I’m currently reading “How Not to Be Wrong – The Hidden Maths of Everyday Life”, a book by Jordan Ellenberg.
The premise of the book is to demonstrate how mathematical thinking can help us understand the everyday world in a deeper, sounder, and more meaningful way.
In the very earliest pages, the author tells the story of mathematician Abraham Wald’s work, advising the US military on how to save planes during World War II.
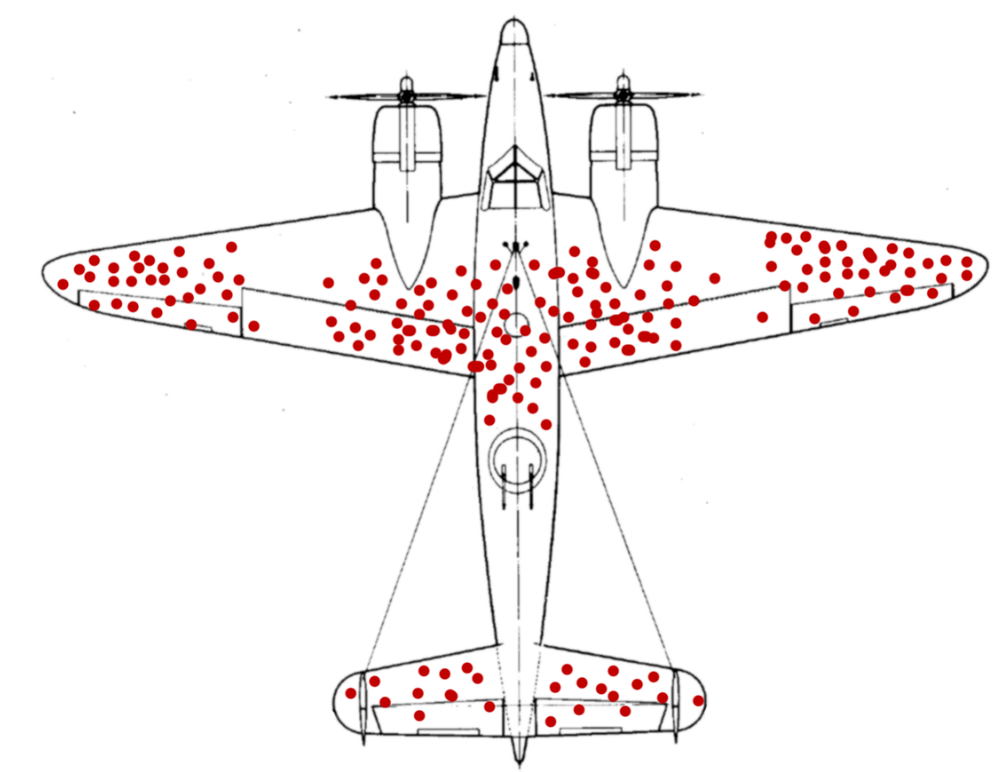
Military data at the time showed that when planes returned from their assignments over Europe, the distribution of bullet hole damage looked like this:

The military wanted to armour the planes on the wingtips and mid-body to reinforce where most of the bullet holes were being received. But Wald disagreed.
Wald’s mathematical training had him asking what assumptions were being made and were they justified? He recognised that planes were of course also getting hit on the nose, engines, and rear body, but those planes were not making it back because they had crashed.
The sample-set for analysis was not complete. The military was only assessing the survivors.
“The sample set for analysis was not complete. The military was only assessing the survivors.”
Wald subsequently advised the military to armour the nose, engine, and rear body. The wingtips and mid-body had proven their ability to take hits and needed no reinforcement at all.
So why do I share this story?
Because the concept above, known as ‘Survivorship Bias’, also applies to the comparison of investment fund performance.
You see, over time, investment funds die for all sorts of reasons. They don’t survive. Some get merged into other funds. Some get renamed. Some change investment aim and/or move into another sector. And some close due to poor sales. But in the main, funds die and are erased from history because of poor performance.
“In the main, funds die and are erased from history because of poor performance.”
Now, if an investor considers a fund sector for their money, and sees the average return over the last 10 years at 8%, what they see is the average of the funds that survived the period. It does not include the poorly performing funds that died along the way, which would naturally drag the average performance figure down.
For example, look at ‘star’ manager Neil Woodford and Woodford Funds, which closed to great media attention last year. The spectacularly poor performance of these funds will not be included in future performance analysis, because the funds are no longer available. And how many funds fail and close without you even hearing about it?
According to an analysis by Standard & Poors, out of the 472 UK Equity funds which started the most recent 10 year period in 2010, 53% of those funds did not survive through to 2020. Therefore, any 10-year average performance comparison made today is not only missing half of the performance data, but any average performance for the period overstates returns. Because it only considers the highest performing survivors.
Survivorship bias is one reason why actively managed funds generally overstate their ability to outperform.
“Survivorship bias is one reason why actively managed funds generally overstate their ability to outperform.”
To combat this, the ‘Standard & Poors Indices Versus Active’ (SPIVA) report compares fund sectors against their benchmark after allowing for survivorship bias and fund costs. Dead fund data is put back in. And lo behold! Nearly 70% of actively managed UK Equity funds do not beat their benchmark over 10 years. This rises to as high as 95% in the US Equity sector.
So, remember. If you’re ever confronted with fund sector performance tables, consider what is not there. Survivorship bias overstates the ability of actively managed funds to outperform. There is a higher chance of investing in a fund that survives over time, as well as providing respectable returns, by choosing a low-cost index tracker.
Follow me on Twitter @AlexandreRiley

